ECMWFThe selected variable and region is available, but not for 2024-06-29, 21:00. You will switch back to the first available time step. The European Centre for Medium-Range Weather Forecasts (ECMWF) creates forecasts for the upcoming 15 days and is a global leader in forecast skill. However, it offers only a small number of parameters for free. The 00Z and 12Z runs are coming in twice daily between 6 and 7 UTC and 18 and 19 UTC.
GEMThe selected variable and region is available, but not for 2024-06-29, 21:00. You will switch back to the first available time step. GEM is the global forecast model of the Canadian weather service and computes 10 day forecasts.
GFSThe selected variable and region is available, but not for 2024-06-29, 21:00. You will switch back to the first available time step. GFS is the global weather forecast model of the US weather service run at an internal resolution of 28 km. It offers a plethora of parameters for the next 15 days. Updated 4 times a day up to 384 hours ahead. The runs for the 0, 6, 12 and 18Z runs are usually coming in from 3:30, 9:30, 15:30 and 21:30 UTC, respectively.
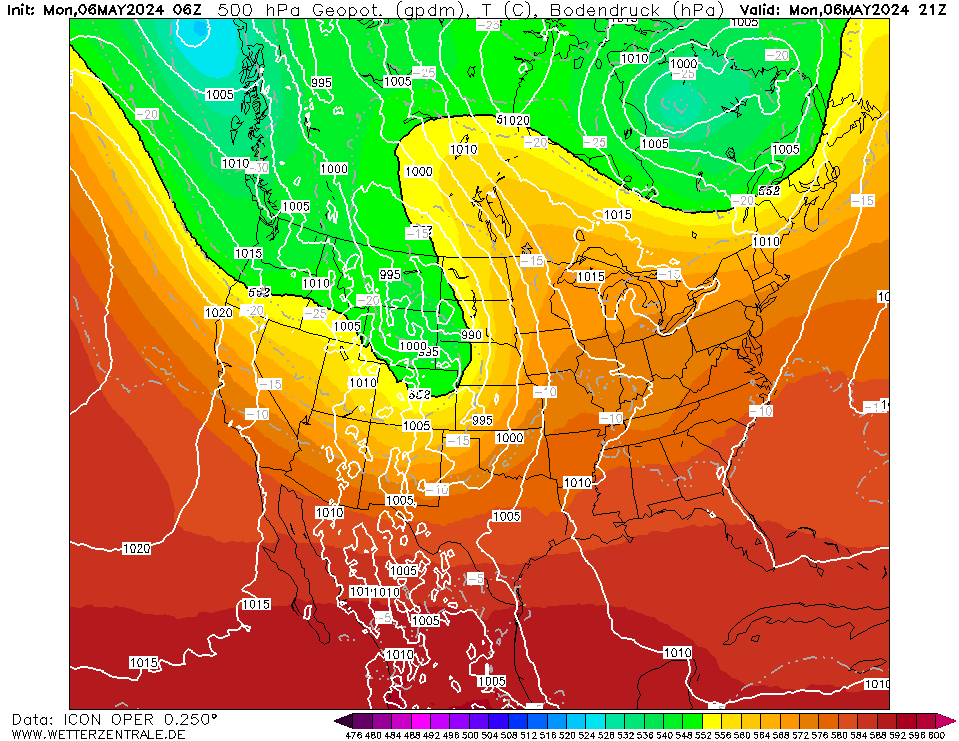
ICONCurrently selected. ICON is the global weather forecast of the German weather service (DWD) with a grid spacing of approx. 13 km globally (Europe nest: 6 km). Model output is available up to 180 hours ahead for the 0Z and 12Z runs, and up to 120 hours for the 6Z and 18Z runs.
JMAThe selected variable and region is available, but not for 2024-06-29, 21:00. You will switch back to the first available time step. The global weather forecast model of the Japanese weather service offers data up to 7 days into the future.
NAVGEMThe selected variable and region is available, but not for 2024-06-29, 21:00. You will switch back to the first available time step. NAVGEM is a model run by the NOAA and serves the US navy with weather forecasts. The WZ maps are based on data that is available from the NCEP server with a grid spacing of 0.5 degree and is updated twice daily (7 and 19 UTC).
UKMOThe selected variable and region is available, but not for 2024-06-29, 21:00. You will switch back to the first available time step. Model output from the United Kingdom Met Office (UKMO). Maps are updated twice daily around 6:45 und 18:45 UTC. Only basic pressure maps are available and forecast data ranges from day 3 to 6.


Member:
OP 0Sat 29 Jun 06:00
1Sat 29 Jun 07:00
2Sat 29 Jun 08:00
3Sat 29 Jun 09:00
4Sat 29 Jun 10:00
5Sat 29 Jun 11:00
6Sat 29 Jun 12:00
7Sat 29 Jun 13:00
8Sat 29 Jun 14:00
9Sat 29 Jun 15:00
10Sat 29 Jun 16:00
11Sat 29 Jun 17:00
12Sat 29 Jun 18:00
13Sat 29 Jun 19:00
14Sat 29 Jun 20:00
15Sat 29 Jun 21:00
16Sat 29 Jun 22:00
17Sat 29 Jun 23:00
18Sun 30 Jun 00:00
19Sun 30 Jun 01:00
20Sun 30 Jun 02:00
21Sun 30 Jun 03:00
22Sun 30 Jun 04:00
23Sun 30 Jun 05:00
24Sun 30 Jun 06:00
25Sun 30 Jun 07:00
26Sun 30 Jun 08:00
27Sun 30 Jun 09:00
28Sun 30 Jun 10:00
29Sun 30 Jun 11:00
30Sun 30 Jun 12:00
31Sun 30 Jun 13:00
32Sun 30 Jun 14:00
33Sun 30 Jun 15:00
34Sun 30 Jun 16:00
35Sun 30 Jun 17:00
36Sun 30 Jun 18:00
37Sun 30 Jun 19:00
38Sun 30 Jun 20:00
39Sun 30 Jun 21:00
40Sun 30 Jun 22:00
41Sun 30 Jun 23:00
42Mon 1 Jul 00:00
43Mon 1 Jul 01:00
44Mon 1 Jul 02:00
45Mon 1 Jul 03:00
46Mon 1 Jul 04:00
47Mon 1 Jul 05:00
48Mon 1 Jul 06:00
49Mon 1 Jul 07:00
50Mon 1 Jul 08:00
51Mon 1 Jul 09:00
52Mon 1 Jul 10:00
53Mon 1 Jul 11:00
54Mon 1 Jul 12:00
55Mon 1 Jul 13:00
56Mon 1 Jul 14:00
57Mon 1 Jul 15:00
58Mon 1 Jul 16:00
59Mon 1 Jul 17:00
60Mon 1 Jul 18:00
61Mon 1 Jul 19:00
62Mon 1 Jul 20:00
63Mon 1 Jul 21:00
64Mon 1 Jul 22:00
65Mon 1 Jul 23:00
66Tue 2 Jul 00:00
67Tue 2 Jul 01:00
68Tue 2 Jul 02:00
69Tue 2 Jul 03:00
70Tue 2 Jul 04:00
71Tue 2 Jul 05:00
72Tue 2 Jul 06:00
73Tue 2 Jul 07:00
74Tue 2 Jul 08:00
75Tue 2 Jul 09:00
76Tue 2 Jul 10:00
77Tue 2 Jul 11:00
78Tue 2 Jul 12:00
81Tue 2 Jul 15:00
84Tue 2 Jul 18:00
87Tue 2 Jul 21:00
90Wed 3 Jul 00:00
93Wed 3 Jul 03:00
96Wed 3 Jul 06:00
99Wed 3 Jul 09:00
102Wed 3 Jul 12:00
105Wed 3 Jul 15:00
108Wed 3 Jul 18:00
111Wed 3 Jul 21:00
114Thu 4 Jul 00:00
117Thu 4 Jul 03:00
120Thu 4 Jul 06:00
help
Download GIF
click
Single-variable mode
You are now in the multi variable mode. Select all the variables of interest and they will be plotted side-by-side in a grid.
You are now in the multi variable mode. Select all the variables of interest and they will be plotted side-by-side in a grid.
URL of this map